
NPS, what it really is
The NPS is the most widely used customer metric in the world. It fits in a single question and takes one subtraction to calculate. According to Bain, which created it, about two-thirds of the Fortune 1000 use it today¹.
Its popularity rests on a simple promise: a single number would be enough to predict a company's growth. Twenty years after its invention, independent research tells a more nuanced story. Here is what you need to know to use it without getting it wrong.
How it works
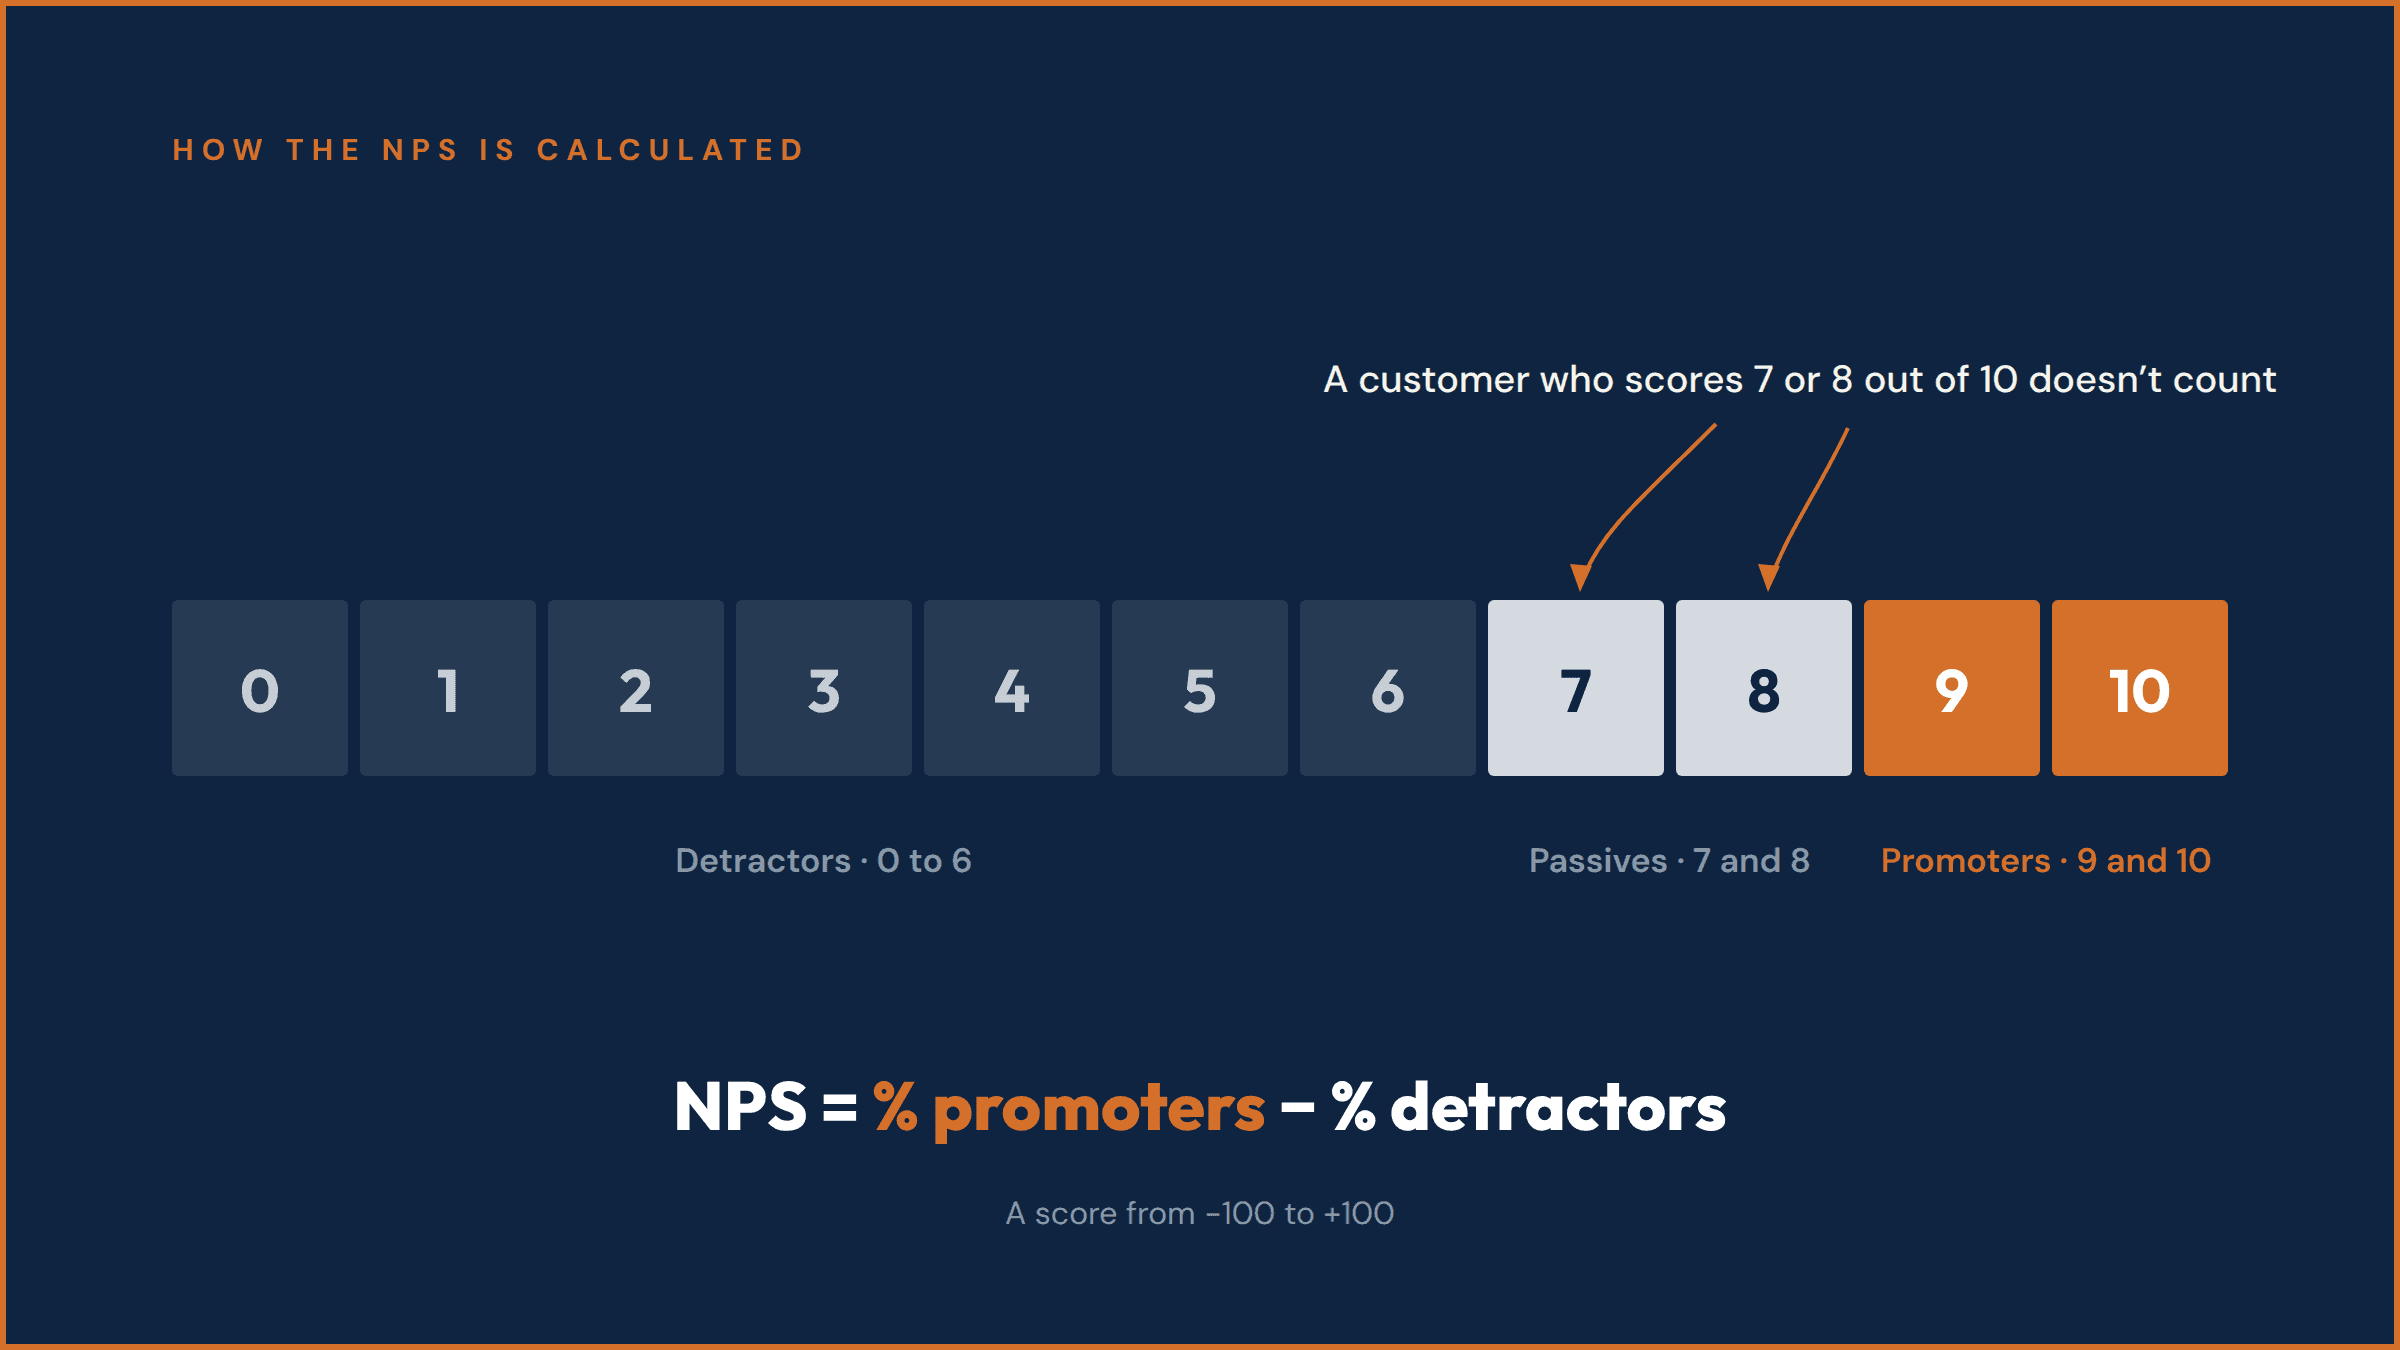
One question: how likely is it that you would recommend [the company] to a friend or colleague? The customer answers on a scale of 0 to 10.
Three groups emerge. Promoters, who score 9 or 10, are convinced enough to recommend the company. Passives, at 7 or 8, are satisfied but not attached, and their loyalty remains uncertain. Detractors, at 6 or below, represent a risk of churn and negative word of mouth.
The score is obtained by subtracting the percentage of detractors from the percentage of promoters. It ranges from −100 to +100.
Where the NPS comes from
Frederick Reichheld published the idea in the Harvard Business Review in December 2003, under the title "The One Number You Need to Grow"². His thesis: companies spend time and money on complex satisfaction surveys, when a single question would be enough to predict growth. The recommendation question.
The idea won people over through its simplicity. One question replaces an entire questionnaire. A single number, comparable over time and across competitors, replaces a dashboard. Companies adopted it en masse over the following decade.
What independent research found
The 2003 thesis rested on a precise claim: likelihood to recommend would predict growth better than any other measure, including satisfaction. That is the claim independent research has not confirmed.
In 2007, four researchers replicated Reichheld's method across 21 companies and more than 15,500 responses, in a study published in the Journal of Marketing. They were unable to reproduce the superiority of the NPS claimed in the original article³. The study received the award for the most significant contribution to marketing practice, granted by the Marketing Science Institute.
An independent replication in 2018 went further⁴. It went back to Reichheld's original data and separated two things he had blended together, the correlation with past growth and the ability to predict future growth. The first link is real. The second is much weaker. Across the same industries, the NPS explains about 38% of the variation in future growth, far from the 76% originally claimed on past growth.
None of this makes the NPS useless. But the original promise, one number that would be enough on its own, has not been confirmed by twenty years of research.
A number that is not always reliable
The problem does not stop at statistical validity. The score itself is not always measured, or reported, honestly.
Reichheld acknowledges this in his 2021 article¹: in some companies, the self-reported score serves communication more than management. Scores published to investors often come without any mention of how many customers were surveyed, or of the response rate. Some companies tie the score to frontline bonuses, which pushes teams to polish the number rather than serve the customer.
Ipsos documents a precise mechanism, known as survey gaming⁵. It cites the example of an account manager who preferentially surveys long-standing, satisfied customers while avoiding recent interactions that went badly. The reported score then has little to do with the reality of the portfolio.
This is a direct point of vigilance for any company measuring its NPS in-house. A high score can reflect a strong customer relationship, or simply a well-chosen sample. The difference lies in how the survey is administered.
Recommendation, satisfaction, loyalty: three different things
The NPS measures an intention, the intention to recommend. Satisfaction measures a judgment on what the customer received. Loyalty is measured by a behavior: staying, buying again.
The first two are close. A happy customer speaks well of you; a disappointed one goes quiet or complains. That is why the NPS and satisfaction overlap to a large extent.
The third is of a different nature. Satisfaction is the lever the company can act on. Loyalty is the result that materializes in the P&L. A customer can recommend a company and leave the following year. The statement and the behavior are not the same thing.
The NPS remains a signal of loyalty. It is not proof of it.
Even Bain has completed its own metric
In 2021, in an article titled "Net Promoter 3.0"¹, Reichheld went further than a simple acknowledgment. He proposed a complementary metric, called Earned Growth, built not on a statement but on actual revenue.
It combines two elements. Net Revenue Retention (NRR) takes the revenue generated this year by customers who were already with you last year and divides it by last year's total revenue. The earned new customer rate (ENC) covers the other side: it takes the revenue from new customers who came through referrals or reputation and divides it by that same total revenue from last year. A new customer won through a commercial discount does not enter this calculation.
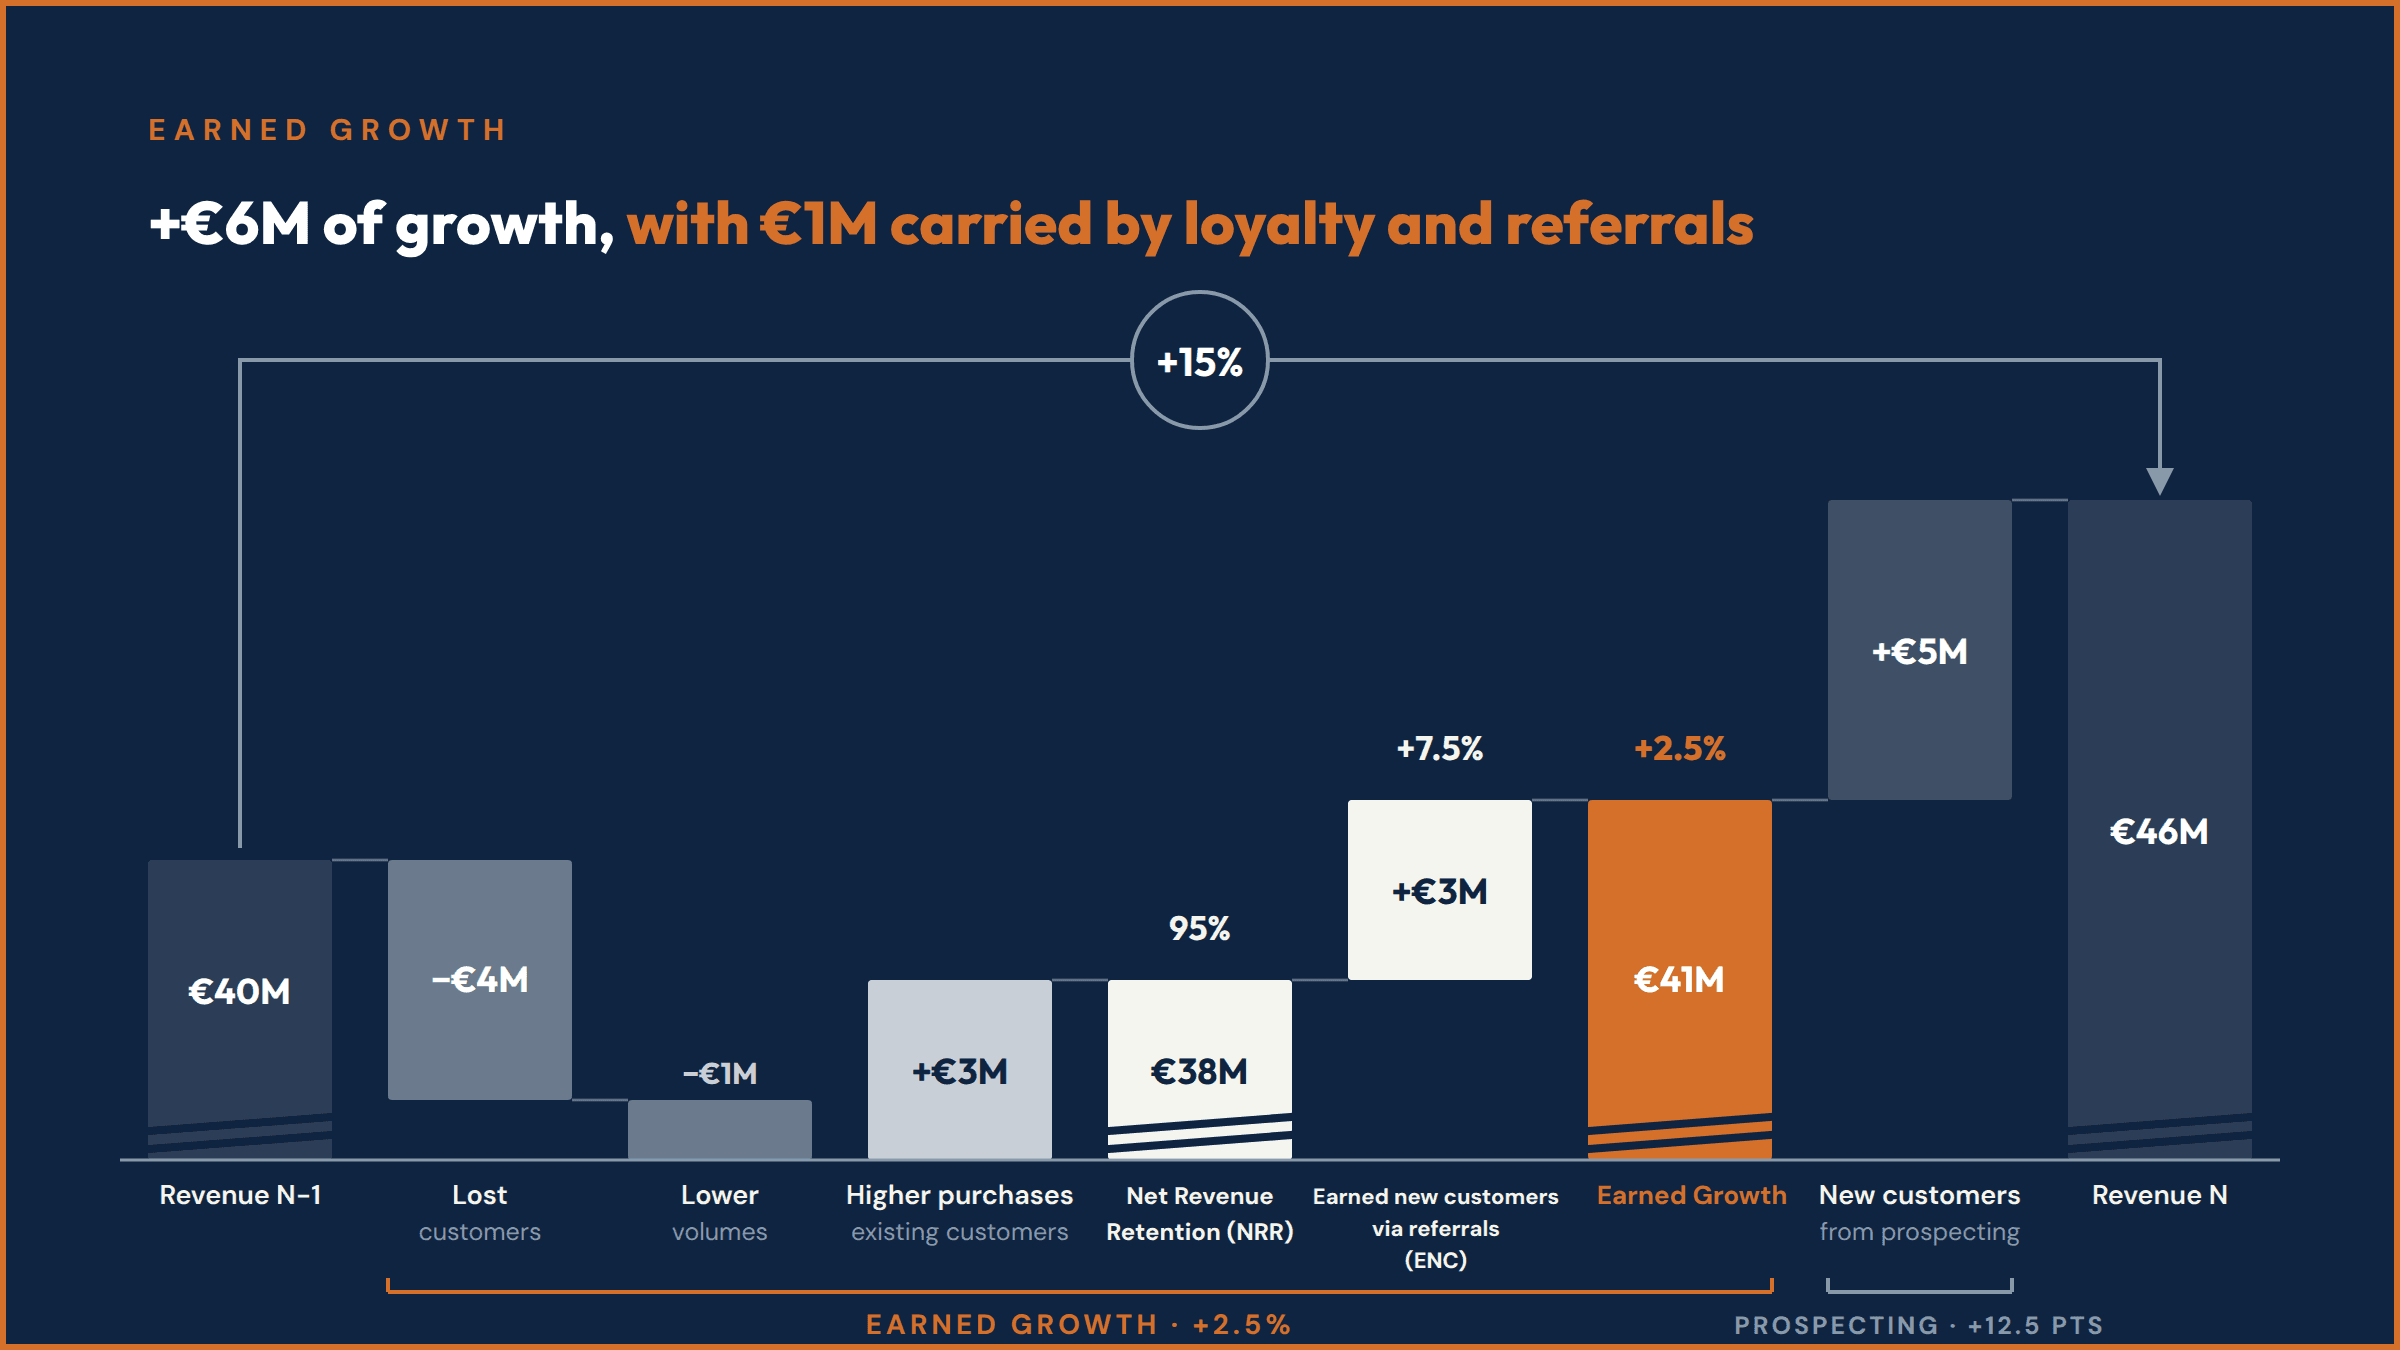
An industrial example. A B2B company goes from €40M to €46M in revenue in one year, a reported growth of 15%.
Let's look at where that growth comes from.
Among the customers already present last year, some accounts expanded their orders, others reduced them or left. On a net basis, that base now weighs €38M this year, against €40M last year. Net Revenue Retention, the NRR, is therefore 95%.
The remaining €8M comes from new customers. Of that total, €3M was earned through referrals or reputation. The remaining €5M was won through the classic route of prospecting. The earned new customer rate, the ENC, is therefore 7.5%.
Earned Growth is therefore: NRR of 95% + ENC of 7.5% − 100% = 2.5%
The gap with the reported 15% says it all. The remaining 12.5 points rest on volume won through prospecting, which has to be won again at every bid. This reading does not pit good growth against bad growth. Winning a competitive bid remains the legitimate daily work of industry, and the 15% is a real commercial performance. But the two kinds of growth have neither the same cost nor the same lifespan. A customer who comes through a referral costs little to acquire, stays longer and generates a higher margin. Research measures a customer value 16 to 25% higher⁶ than that of a comparable customer acquired through marketing. Earned Growth is therefore not a judge of growth. It is an optimization instrument. It shows where to invest so that the next point of growth costs less and lasts longer.
In other words, the inventor of the NPS went looking for proof on the side of behavior, precisely because the statement was not enough.
What to take away
The NPS has real merit. It sets a heading, it compares easily over time and across players in the same market, and it flags early the customers at risk of leaving. Inexpensive, and far better than nothing, provided you know who answered and how many.
It does not replace the analysis of causes, which a well-built satisfaction survey reveals. Nor does it replace the proof of actual behavior, which can be read in revenue by account.
In industrial B2B in particular, an isolated score, measured once a year, is never enough to base a decision on. It should be read alongside a satisfaction measure, and alongside what the customer actually does.
What we do at L'ÉCART
The NPS has its place in PULSE, our recurring barometer. But on its own, it is not enough. We add a distinct question, also self-reported, but turned toward the decision rather than the opinion. Does the customer intend to renew with you at the next contract renewal? The two scores often overlap. It is their gap, account by account, that interests us. The customer who gladly recommends but hesitates to renew is an at-risk account that the NPS alone does not reveal.
We do not push for the adoption of Earned Growth. Our conviction lies elsewhere. What matters most is a voice-of-customer program, satisfaction survey and NPS, executed well and regularly, that produces decisions and opens up a gap in the market. Most industrial companies do not have that foundation yet. That is what changes the trajectory, not one more metric.
For companies where that foundation is already running and where marketing and commercial excellence is a given, adding Earned Growth can be the next step. Not in every B2B sector. On a concentrated portfolio, the aggregate rate says less than the account-by-account reading.
DIAGNOSTIC measures neither NRR nor ENC. It carries the same conviction with a different instrument: crossing stated satisfaction with the financial weight of each account, to name the high-revenue or high-margin accounts showing signs of risk. A self-reported number on its own says nothing until it is confronted with actual buying behavior.
That is the whole purpose of L'ÉCART's Customer Experience Program.
Compare the programs
Sources
Reichheld F., Darnell D., Burns M., "Net Promoter 3.0", Harvard Business Review, November–December 2021.
Reichheld F., "The One Number You Need to Grow", Harvard Business Review, December 2003.
Keiningham T., Cooil B., Andreassen T. W., Aksoy L., "A Longitudinal Examination of Net Promoter and Firm Revenue Growth", Journal of Marketing, July 2007. 21 companies, more than 15,500 responses.
Sauro J., "The One Number You Need to Grow: A Replication", MeasuringU, December 2018. Re-analysis of Reichheld's original data across seven industries.
Ipsos, on survey gaming in NPS programs.
Schmitt P., Skiera B., Van den Bulte C., "Referral Programs and Customer Value", Journal of Marketing, January 2011. Study of roughly 10,000 retail-banking customers in Germany. A B2C context: a strong signal, not proof for industrial B2B.